Evidence · first-party tested
Recovers chart values and tags the asset, but presents the result as raw delimiter-separated text instead of preserving a meaningful visual chart layout.
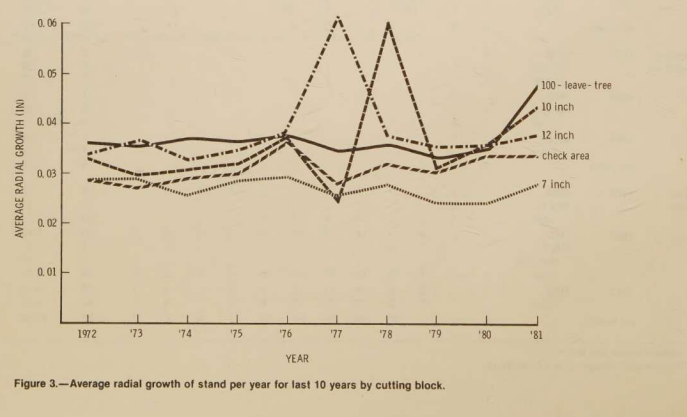
Scanned line chart of average radial growth by treatment from 1972–1981.
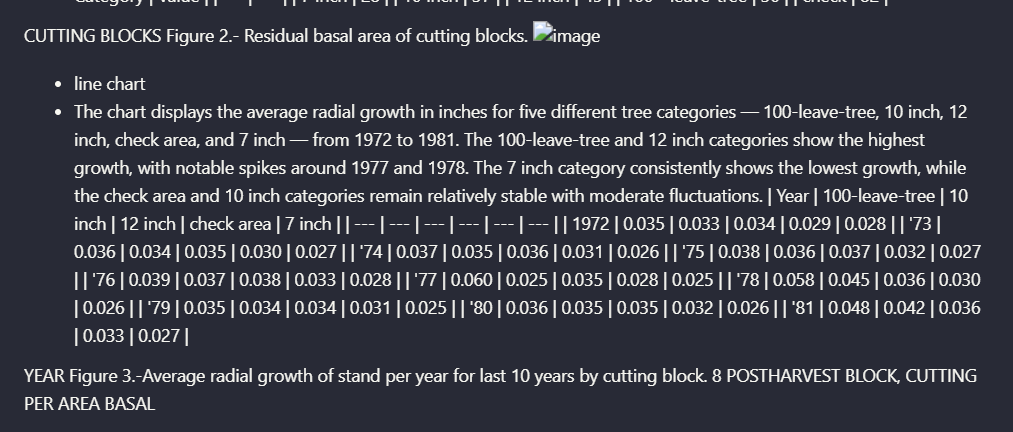
OCR summary and extracted values for the radial growth line chart.
The observation
Recovers chart values and tags the asset, but presents the result as raw delimiter-separated text instead of preserving a meaningful visual chart layout.
Criterion: Visual Content Retention · Scenario: Scanned Research Paper (group: scanned-research-paper)
Query this
get_evidence({
  tool: "upstage-ai",
  scenario: "scanned-research-paper"
})
MCP · mcp.aidemos.com/api/mcp
Free with attribution.
Free with attribution.
Same input, other tools
Real outputs, no retouching · every cell queryable via API & MCP · aidemos.com