Evidence · first-party tested
A scanned chart is separated into a structured table with 3 years and 5 treatment columns, preserving the legend-to-values mapping even though the visual chart form is replaced.
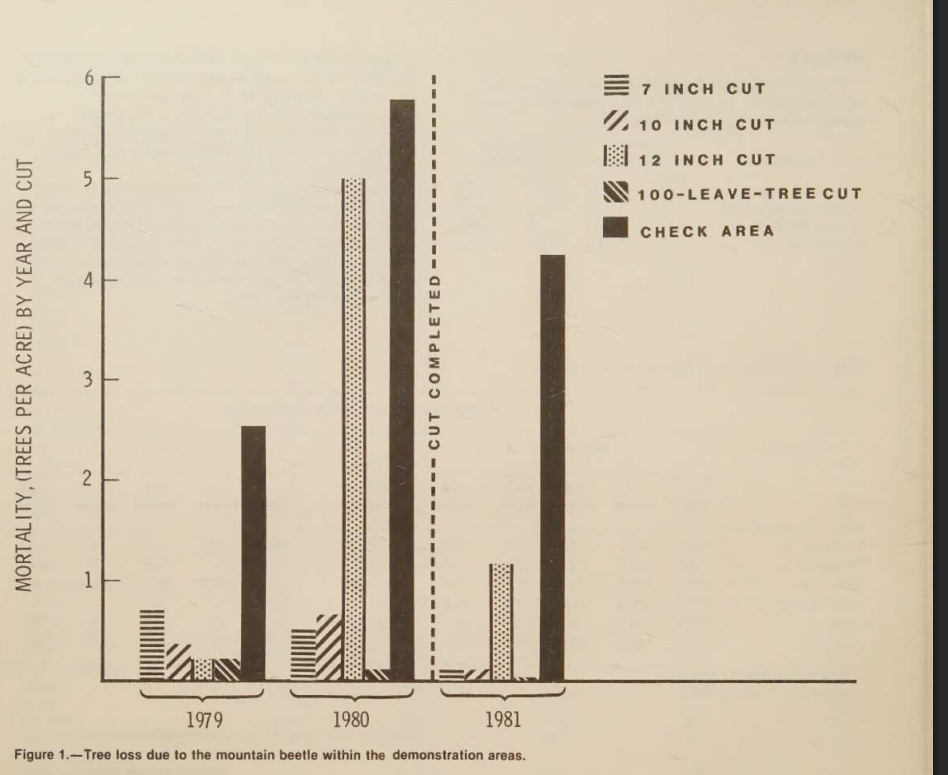
Bar chart of tree mortality by year and treatment.
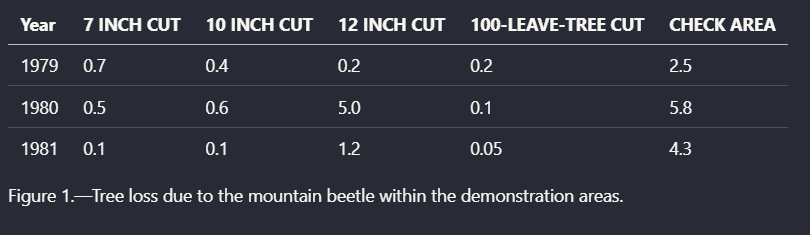
Extracted yearly tree-loss table with figure caption.
The observation
A scanned chart is separated into a structured table with 3 years and 5 treatment columns, preserving the legend-to-values mapping even though the visual chart form is replaced.
Criterion: Advanced Features (Bonus) · Scenario: Scanned Research Paper (group: scanned-research-paper)
Query this
get_evidence({
  tool: "llamaparse",
  scenario: "scanned-research-paper"
})
MCP · mcp.aidemos.com/api/mcp
Free with attribution.
Free with attribution.
Same input, other tools
Real outputs, no retouching · every cell queryable via API & MCP · aidemos.com