Evidence · first-party tested
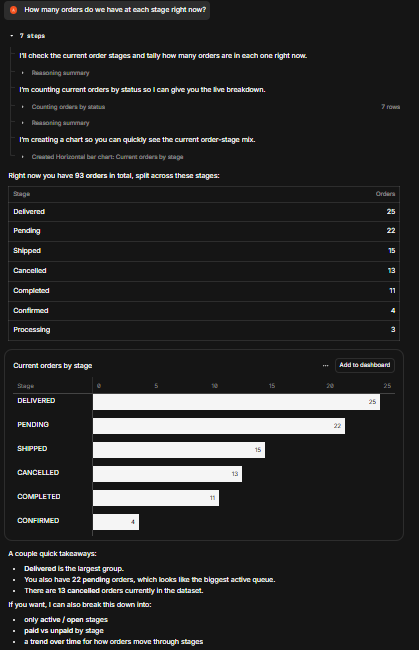
The tool automatically created a horizontal bar chart for the current order stages, giving a visual breakdown of the live pipeline.
The observation
The tool automatically created a horizontal bar chart for the current order stages, giving a visual breakdown of the live pipeline.
Criterion: Chart / Visualization Support · Scenario: Order pipeline stages, delivered-vs-cancelled, pending-but-paid, and last-month comparison (group: live-database-business-questions)
Query this
get_evidence({
  tool: "basedash",
  scenario: "live-database-business-questions"
})
MCP · mcp.aidemos.com/api/mcp
Free with attribution.
Free with attribution.
Same input, other tools
Real outputs, no retouching · every cell queryable via API & MCP · aidemos.com