Evidence · first-party tested
Represents chart content as a captioned figure that preserves the chart’s meaning, but does not recreate the visual plot inline.
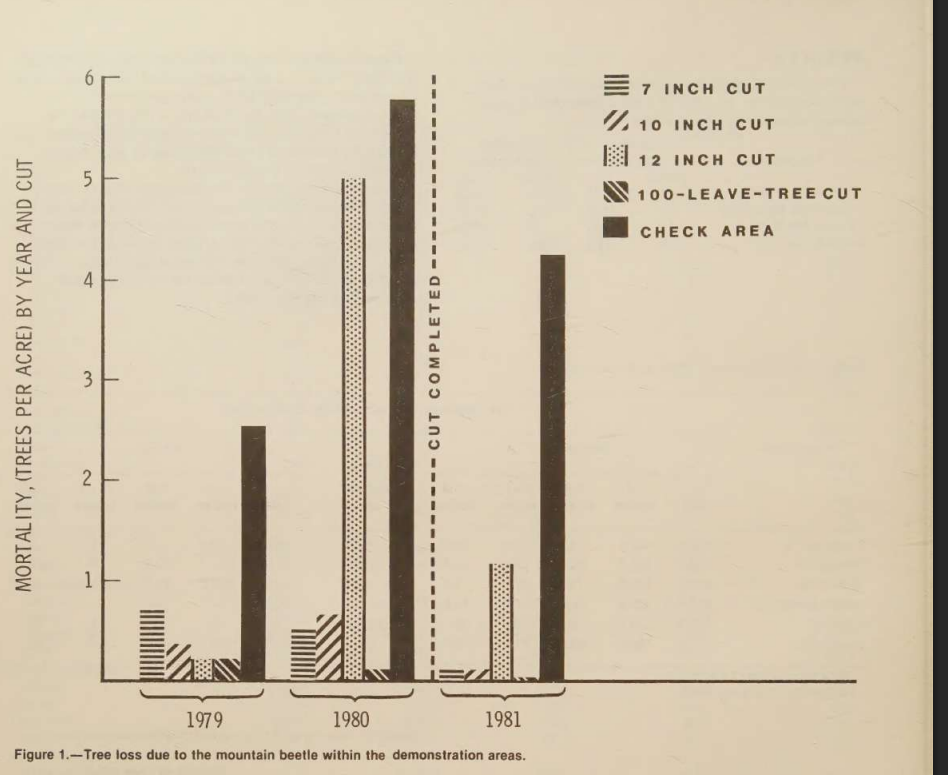
Scanned bar chart of tree mortality by year and treatment.
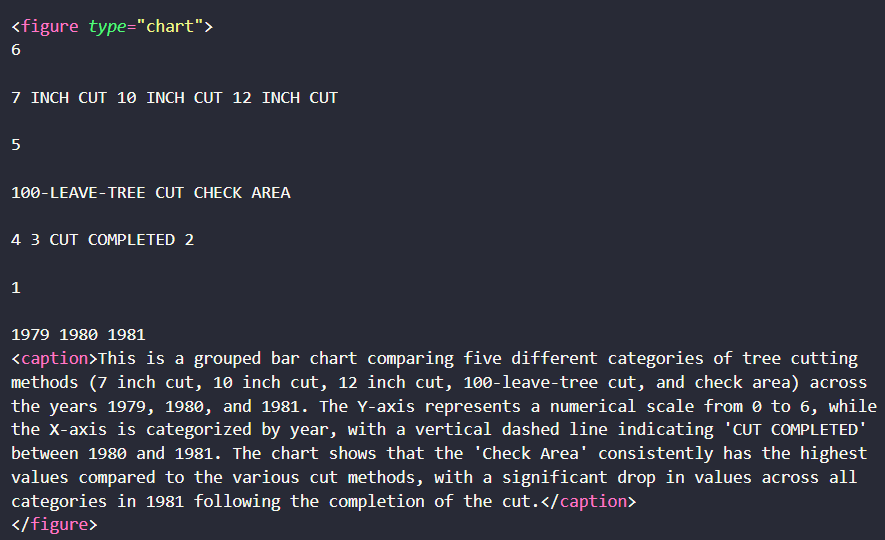
Parsed text output for the tree-mortality chart.
The observation
Represents chart content as a captioned figure that preserves the chart’s meaning, but does not recreate the visual plot inline.
Criterion: Visual Content Retention · Scenario: Scanned Research Paper (group: scanned-research-paper)
Query this
get_evidence({
  tool: "extend-ai",
  scenario: "scanned-research-paper"
})
MCP · mcp.aidemos.com/api/mcp
Free with attribution.
Free with attribution.
Same input, other tools
Real outputs, no retouching · every cell queryable via API & MCP · aidemos.com