Evidence · first-party tested
Converts chart graphics into text-based value summaries and explanatory prose, but does not preserve the chart itself as a visual element in the extracted output.
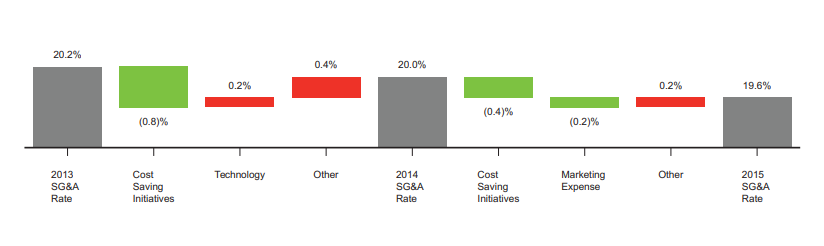
Waterfall chart showing SG&A rate movement from 2013 to 2015.
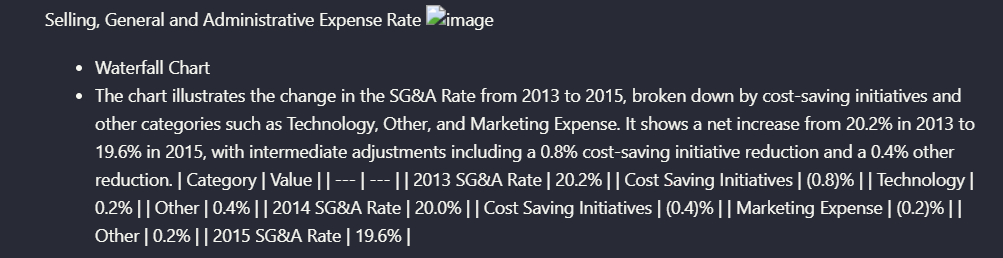
Text extraction describing the SG&A rate waterfall chart.
The observation
Converts chart graphics into text-based value summaries and explanatory prose, but does not preserve the chart itself as a visual element in the extracted output.
Criterion: Visual Content Retention · Scenario: Sumitomo Heavy Industries Consolidated Financial Report (group: financial-report)
Query this
get_evidence({
  tool: "upstage-ai",
  scenario: "financial-report"
})
MCP · mcp.aidemos.com/api/mcp
Free with attribution.
Free with attribution.
Same input, other tools
Real outputs, no retouching · every cell queryable via API & MCP · aidemos.com