Evidence · first-party tested
The extractor can recover chart values, but it does not reconstruct chart semantics such as axes, legend relationships, or chart type, so the visualization collapses into plain linear text.
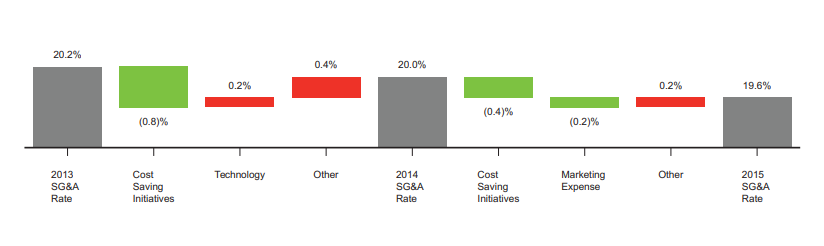
Waterfall chart showing SG&A rate movement from 2013 to 2015.
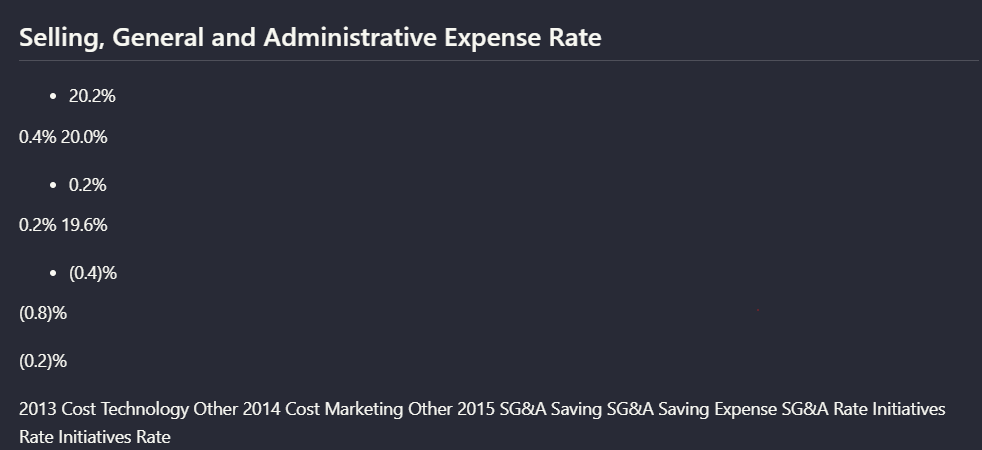
Nutrient.io — nutirent_hybrid_earningspdf_parsed_waterfall_chart.png
The observation
The extractor can recover chart values, but it does not reconstruct chart semantics such as axes, legend relationships, or chart type, so the visualization collapses into plain linear text.
Criterion: Visual Content Retention · Scenario: Target 2015 Annual Report (group: financial-report)
Query this
get_evidence({
  tool: "nutrient-io",
  scenario: "financial-report"
})
MCP · mcp.aidemos.com/api/mcp
Free with attribution.
Free with attribution.
Same input, other tools
Real outputs, no retouching · every cell queryable via API & MCP · aidemos.com