Evidence · first-party tested
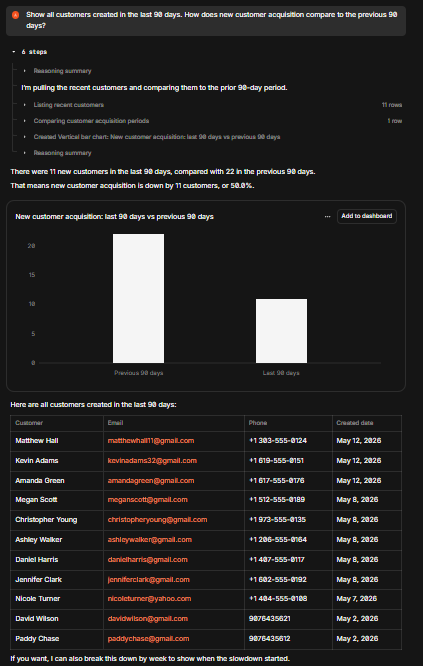
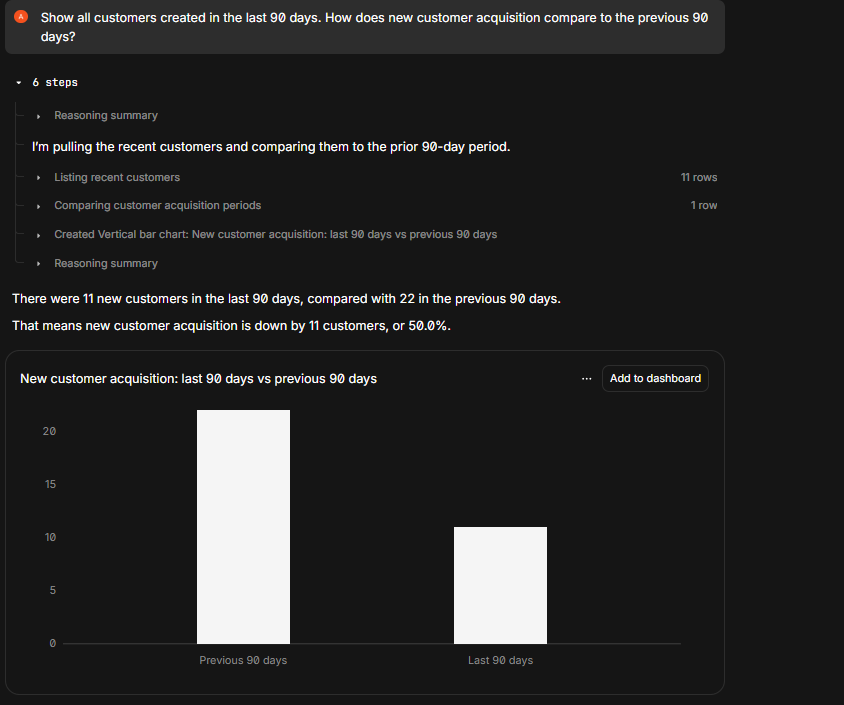
The tool automatically generated a vertical bar chart comparing the two 90-day periods, without needing a separate chart prompt.
The observation
The tool automatically generated a vertical bar chart comparing the two 90-day periods, without needing a separate chart prompt.
Criterion: Chart / Visualization Support · Scenario: Customer acquisition over the last 90 days vs the previous 90 days (group: live-database-business-questions)
Query this
get_evidence({
  tool: "basedash",
  scenario: "live-database-business-questions"
})
MCP · mcp.aidemos.com/api/mcp
Free with attribution.
Free with attribution.
Same input, other tools
Real outputs, no retouching · every cell queryable via API & MCP · aidemos.com